Quick Introduction to tidycensus
Paul L. Delamater
Odum Institute
February 26, 2024
Overview
From the tidycensus website:
tidycensus is an R package that allows users to interface with a select number of the US Census Bureau’s data APIs and return tidyverse-ready data frames, optionally with simple feature geometry included.
Why Important
In the past, retrieving data from the US Census was quite burdensome and often included visiting multiple websites. This was especially true when gathering both tabular and spatial data. The advent of the Census Application Programming Interface (API) allowed for the development of tidycensus, which uses the R programming language to construct requests to the API (as well as other tools such as the censusapi and tigris packages). As such, all data retrieval tasks are centralized and they are reproducible!
How does it work?
Predefined functions are used to construct an API call, which is sent to the Census data servers. There are distinct functions that request data from various Census data sources. Function parameters are used to define the details of the request, which can include:
- Geographic extent
- Geographic aggregation level
- Variables or characteristics
- Year
- Survey type (for ACS data)
- Spatial data
For example this R command…
durham_MHI_tct <- get_acs(       ### Defines the data source
  survey = "acs5",               ### Defines the type of ACS data
  year = 2020,                   ### Defines the last year (for mult year estimates)
  geography = "tract",           ### Defines geographic resolution
  variables = "B19013_001",      ### Defines the variable (in this case, MHI)
  state = "NC",                  ### Defines the state
  county = "Durham",             ### Defines the county
  geometry = TRUE                ### Include spatial features
  )
…can be translated to “Retrieve American Community Survey (ACS) 5-year estimates (2016-2020) of Median Household Income at the census tract-level for Durham County, North Carolina; include the tract polygons.”
And, because both the tabular values and spatial features are
returned in the object durham_MHI_tract, it is very easy to
create a quick choropleth map!
tm_shape(durham_MHI_tct) +
  tm_polygons("estimate",
              style = "pretty",
              title = "Median Household Income") +
  tm_layout(frame = FALSE,
            legend.outside = TRUE,
            legend.outside.position = "left")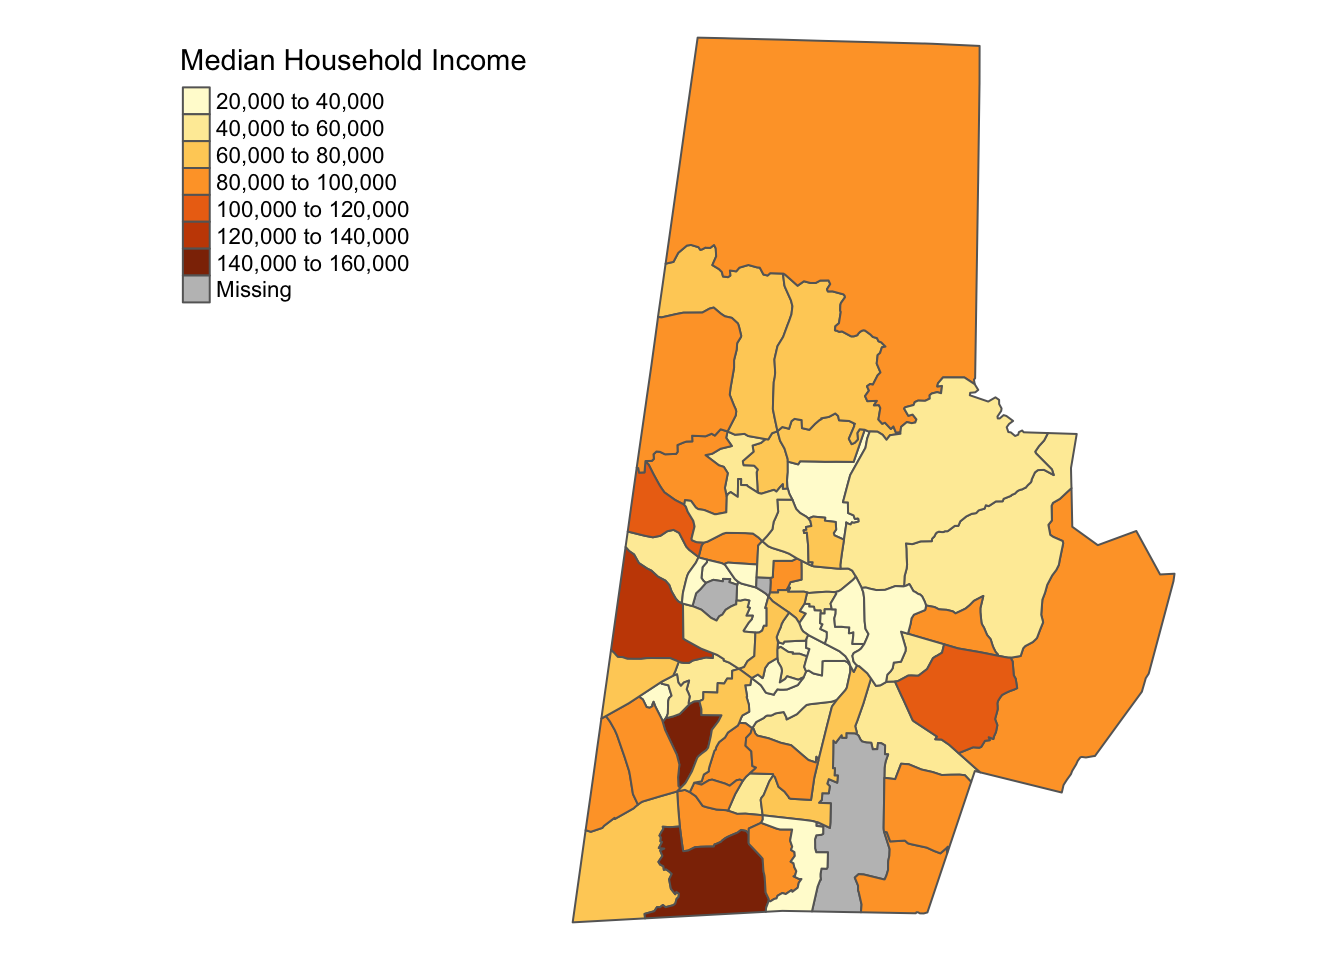
This page was last updated on February 26, 2024